REAL OR NOT REAL? Debunking some of the assumptions in our industry.
This is the basis of a presentation delivered in Munich on 30/08/2022, at the invitation of Fabric Start/Bluezone.

The past 3 months have seen shock and upheaval in “sustainable'' apparel. It began with the New York Times’ highly critical assessment of the Higg MSI - an assessment that was based, incidentally, on The Great Green Washing Machine Part 2: The Use and Misuse of Sustainability Metrics in Fashion . This was followed by the Norwegian Consumer Authority’s (NCA) ruling against Norrona’s use of the MSI to make claims about the ‘sustainability’ of its organic cotton tees. And most recently a class action suit was filed against H&M, for making misleading sustainability claims about its products, in the state of New York.
Trade magazine Apparel Insider has published a great open-source article on the H&M suit, its chances of success, and the almost certainty that this is just the first such action, and H&M just the first brand to be targeted - other suits will follow. I strongly recommend that you all read it. Then go to the Geneva University Center for Business and Human Rights website and read our latest white paper: The Rise of Life Cycle Analysis and the Fall of Sustainability.
Put the two together and it should be pretty clear that your wisest course of action would be to listen to one of fashion law’s leading authorities, Alan Behr:
“The key learning is: unless you and you alone really can be sure that what you are doing is better for the environment... it is far too early in all this to start boasting about it in your marketing materials. Since no one can be entirely sure about the environmental impact of much of fast fashion at this time, making a point of it until science has done more groundwork could well lead to more troubles like this."
Introducing legislation to halt global warming is currently a priority in many western nations, so this afternoon, I am going to focus on GHG emissions. First, I am going to demonstrate the empty promise of preferred fibers - empty because the data to evaluate what is better and what worse simply does not exist. And empty because fiber production is only 10% of apparel’s global GHG impact in any case. Then I will touch upon the difference between sustainability and environmental impact and why to be sustainable, you should really focus on what you sell and how you sell it. And finally I’m going to end on a positive note, and show you something brands could easily do to significantly reduce the GWP associated with their purchase decisions.
1. The empty promise of preferred fibers:
We don’t have time to cover all “preferred” fibers this afternoon. There is more on the shortcomings of Better Cotton Initiative cotton, as well as r-PET in The Great Green Washing Machine Parts 1 and 2.
But I imagine that many of you have made organic cotton claims - something to the effect that organic cotton consumes 92% less water and emits 45% less CO2e, than conventional cotton - and you are wondering if you are at risk of prosecution.The answer, I’m afraid, is possibly yes, and the case of organic cotton provides an excellent illustration of the perils and pitfalls of making LCA based claims without adequate grounding in data.
Let’s cut to the chase: no LCA anywhere has ever found that organic cotton consumes less water than conventional cotton, grown in the same place, at the same time, and under the same conditions. The critical determinant of irrigation needs is rainfall, which of course, varies by year and by location. Based on ICAC data, the world average use of irrigation water in organic production in 2018/19, was actually about one-third higher than irrigation water use per kilogram of lint in conventional cotton production, over the same period.
So where does the fairytale that organic cotton consumes roughly 90% less water than conventional cotton come from? I am going to show you in 5 screenshots exactly where that mirage came from. But please don’t just believe me, or anyone else. Take Alan Behr’s advice.You are the ones who will be liable for your claims. If you want to avoid lawsuits you must check this - and every other claim - for yourselves.
The first screenshot in this series shows the cover of the report that started it all. As you can see, no matter what anyone may have told you - and there was a lot of nonsense about this last year - this report is NOT an LCA, and it was not written by an LCA provider.
It says so. It's titled a “Summary of Findings” and it was produced by Textile Exchange (TE).

https://store.textileexchange.org/product/the-life-cycle-assessment-of-organic-cotton-fiber-summary-of-findings/
What does this ‘summary’ say? Please look at the second screenshot in this series. It’s from page 18 in that summary. And it states unambiguously that the LCA that TE commissioned from PE International (now Sphera) found - and I quote - 91% reduced water consumption and 46% reduced GWP, attributable to the organic production system. Which those of you who use the MSI will know, is also what The Higg Index claims, and it’s the claim that got Norrona into trouble.

https://store.textileexchange.org/product/the-life-cycle-assessment-of-organic-cotton-fiber-summary-of-findings/
So did the LCA that TE and the MSI refer to, find those impact savings? Well let’s look at that LCA and see for ourselves. The next screenshot is the cover of that report. As you can see, this report is an LCA. It was produced by an LCA provider: PE International/Sphera. And it was commissioned by Textile Exchange. As any of you who read our recent white paper will immediately realize, this means that it was Textile Exchange who were allowed to choose the boundaries and methodologies, as well as where and how to source the base data. In the event, Textile Exchange themselves provided the data, and they selected primarily organic farmers in rainfed areas.
https://store.textileexchange.org/product/life-cycle-assessment-of-organic-cotton/
It is common sense that, as the LCA pointed out, and as the fourth screenshot in this series shows, this meant that any apparent water saving could not be attributed to the cultivation system. It just reflected rainfall. So, as the LCA states the low irrigation rates can’t be attributed to the fact that the cotton was cultivated organically.

https://store.textileexchange.org/product/life-cycle-assessment-of-organic-cotton/
The LCA then, did NOT find a 91% reduction in water consumption attributable to the organic production system. It found a 91% reduction in water consumption that was attributable to rainfall.
And what about the claim that the LCA found a 46% reduction in GWP? That’s not true either. TE decided to exclude the impacts of manure production from the LCA accounting. PE international observed that this was anomalous, and as the final screenshot in this series shows, they noted that depending on the method of allocation applied, including manure within the boundary, would increase the GWP attributed to organic production by between 76% and almost 400%. Given that TE claims only a 45% reduction in GWP to begin with, this is clearly non-existent in reality and the inverse almost certainly applies. When you account for the methane emitted in manure production, the GHG emissions associated with organic cultivation are considerably higher than those associated with conventional practices.

https://store.textileexchange.org/product/life-cycle-assessment-of-organic-cotton/
We should also remember that cotton is in the ground for only 6 months of the year. For the other six months, those Indian/Burkinabe/Malian/Pakistani cotton fields will generally produce food crops such as corn, wheat, soybean,chickpeas, peanuts, and rice. Farmers cannot switch from organic to conventional cultivation and back, with every season, which means they are going to have to produce their food crops organically as well.
Whilst I would not agree with the Wall Street Journal that the collapse of Sri Lankan crop yields, and the country’s ensuing economic crisis, shows that organic production doesn’t work at all, it does show that the amount of food that you will get from any given field is much lower under organic cultivation, than under conventional. In a world where so many are still hungry, this has serious implications.
At the beginning of this month the New York Times published the following statements:
“Across the globe, as many as 828 million people — one tenth of the world’s population — were undernourished last year” and
“As many as 50 million people in 45 countries are teetering on the brink of famine, according to the U.N.’s World Food Program.”
Clearly, trying to force farmers in the global south to produce cotton organically, drastically reducing their food crop yields in the process, all in the name of ‘sustainability’, is an absolute non sequitur.
Going forward, there are obviously lessons to be learned from all this, and I would echo Alan Behr’s observations: The scientific groundwork needed to make LCA based comparative sustainability claims simply is not there yet. Don’t rely on third party certifications or third party advice to tell you that it is. Check it yourself. If you can’t prove your claim. Do not make it.
Which brings us neatly to two points that I would like you to bear in mind before making any environmental impact or ‘sustainability’ claims, going forward:
Sustainability has a human, socio-economic dimension. If you can’t prove that whatever it is that you are referring to, made the farmers/workers involved better off - and self-reported ‘data’ by an implementing initiative is categorically not proof - then only refer to whatever it might be, as having improved environmental impact. Don’t use the word ‘sustainability’ at all, unless you can satisfy the socio-economic condition.
The only way to achieve a net reduction in global emissions in apparel is for the global north as a whole to buy fewer clothes and to wear each and every item more times. Apparel is not a sandwich, it is not impact at the factory gate that matters. It is impact per wear. If your jeans have a production impact of 11kg CO2-Equiv and they are worn 10 times, that’s 1.1 kilos of CO2 per wear. If they have an impact of 20kg CO2-Equiv, but they are worn 100 times, that’s only 0.2 kilos of CO2 per wear. Moreover, in the second case, after 100 wears there is only one pair of discarded jeans to process. In the first case, there are 10 pairs.
Manufacturing and marketing your denim in a manner that increases the number of times your customers wear each item, is doubly beneficial. It reduces impact per wear and it reduces waste.
So much for what you can’t do - apart from manufacturing and marketing your denim in a manner that increases the number of times your customers wear each item, what else can you do?
2. Focus on Manufacturing:
To illustrate the point that I am making here, we’re going to start with a few charts.
Chart number one comes from a 2020, UNEP report that is based on Quantis’ WALDB data - so a lot, if not all of this data also underpins the current version of the PEF, and the MSI.
This chart shows that Fiber Production generates 12% of the greenhouse gas (GHG) emissions in global apparel.
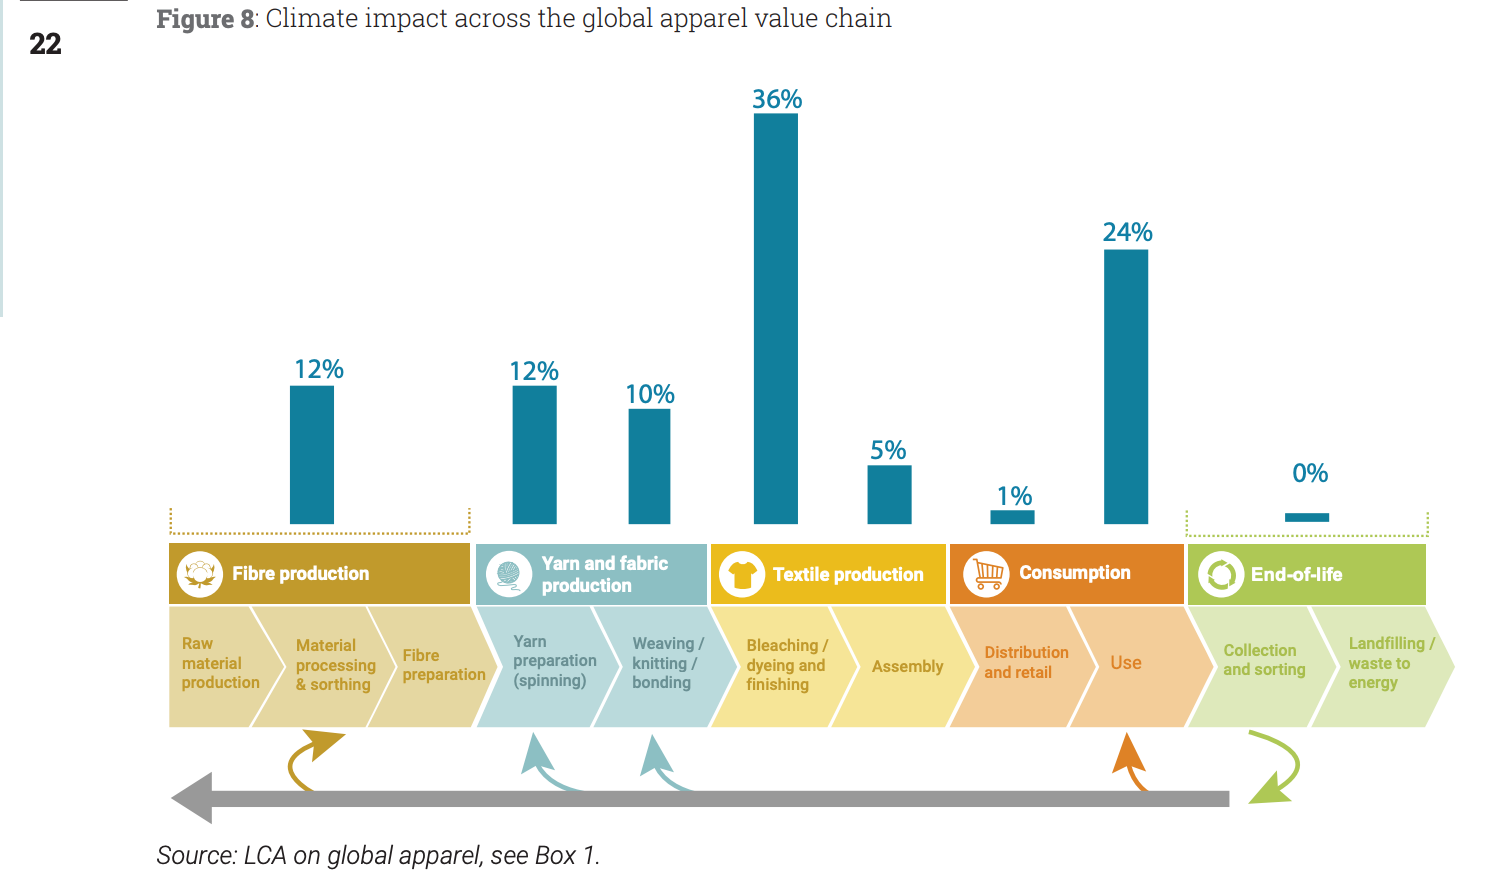
UNEP Sustainability and Circularity in the Textile Value Chain: Global Stocktaking https://wedocs.unep.org/handle/20.500.11822/34184
Next, we have a similar chart - which covers H&M’s 2018, scope 3, GHG emissions. It states that raw materials (fiber production) generate 11% of the GHG emissions in H&M’s product supply chain, and it is based, in good part, on the MSI.

https://hmgroup.com/wp-content/uploads/2020/10/HM-Group-Sustainability-Performance-Report-2019.pdf
The third chart and the final chart in this series is from Mistra Future Fashion, 2019. This study used almost exactly the same data sources as the MSI to evaluate Swedish apparel consumption, and it states that fiber production contributes 14.6% of the life cycle GHG impacts - based on an EU grid mix for retail and end of life. If the Swedish grid mix is used, that figure rises to 16. 3%, because laundry for instance, falls from 12.8% to 2.9%. All of which to say - in apparel, the grid mix is vitally important. And I’ll be talking a little more about that in a minute.

Since all three charts are underpinned by pretty much the same data as is used in the MSI, the Science Based Targets, and the transition phase of the PEF, they have all of the data shortcomings that Professor Baumann Pauly and I outlined in our recent white paper.
In the present context however, the errors and omissions that report highlights, simply reinforce the argument that I am presenting here today: the relative contribution of fiber production to apparel’s total impact is hardly significant. Give or take, around 10% of GHG emissions in the global apparel value chain can be attributed to fiber production. Between 60% and 70% occur in manufacturing. Even if you halve raw material emissions, you will only reduce total GHG emissions by less than 5%.
So why is everyone focusing on raw materials? There is no magic wand that will suddenly eliminate all GHG emissions in fiber production. Similarly, switching to ‘Infinited fiber’ or some other innovative or recycled material, still leaves you with exactly the same impact from spinning through to finishing, and possibly end of life, depending on the level of genuine recycling that actually takes place. For example, the recycling of PET bottles is well established but only 29% were recycled in the USA, in 2018.
These charts show that GHG emissions from spinning through to finishing constitute around 80% of total production emissions. If that is remotely accurate, just a 10% reduction in these GHG emissions - surely relatively easy to achieve - would have the same impact as reducing raw material emissions by two thirds.
Clearly the place to start is manufacturing and Pietro will be making a few suggestions as to how manufacturers can do this. If you’re not a manufacturer and you just purchase denim, the quickest and easiest thing that you can do is to source from countries with a low carbon intensity electricity grid mix whenever possible, and I am going to end today by showing you why that is the case.
The carbon intensity of national grid mixes is documented. The data is publicly available, so the accuracy of your impact claims can easily be verified by anyone - no need for initiatives or certifications.
The two charts that you see here come from Our World In Data.
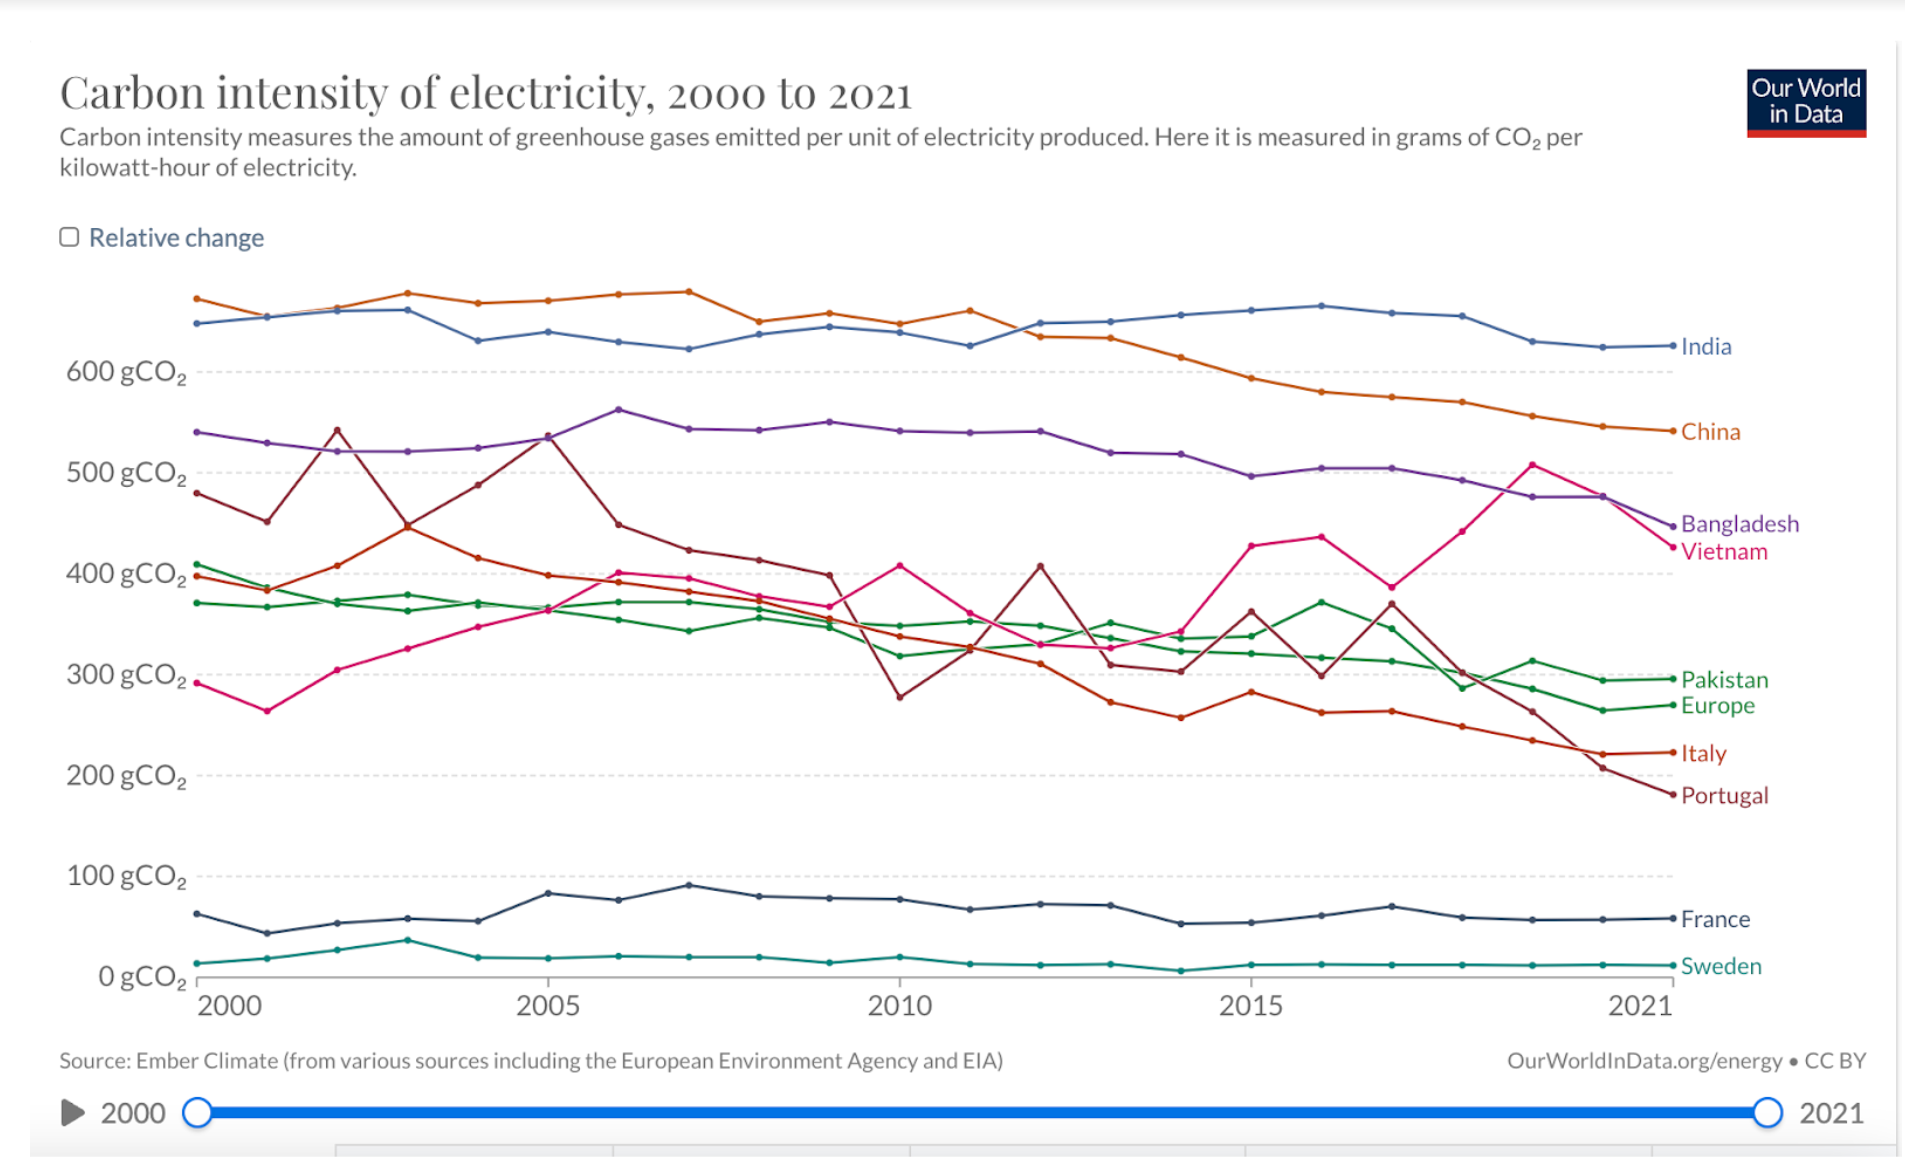
https://ourworldindata.org/explorers/energy?facet=none&country=USA~CHN~OWID_WRL~IND~BRA~ZAF&Total+or+Breakdown=Total&Select+a+source=Low-carbon&Energy+or+Electricity=Electricity+only&Metric=Carbon+intensity
We can now see clearly why, as I mentioned earlier, switching from a Swedish to a European grid mix made such a difference for relative impacts in the MISTRA chart. It would have a similar impact on manufacturing emissions.

https://ourworldindata.org/explorers/energy?facet=none&country=USA~CHN~OWID_WRL~IND~BRA~ZAF&Total+or+Breakdown=Total&Select+a+source=Low-carbon&Energy+or+Electricity=Electricity+only&Metric=Carbon+intensity
The GHG impact of spinning is almost entirely due to electricity. As these charts show, switching your yarn purchases from India/Bangladesh/China to Italy/Portugal/France could reduce those manufacturing emissions by as much as 90%. Switching from any of the top three to Portugal would more than halve them. By the same token, if you are a manufacturer and you install your own wind or solar power, you could, verifiably, reduce your own GHG impacts.
The downside for brands of course, is that either solution will cost more money. The question then becomes: do you want to produce with the lowest GHG emissions possible? Or do you want to produce as cheaply as possible? As regulators look ever closer at impact claims, you are going to have to choose.